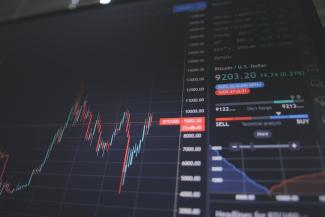
Market Volatility
As we continue to endure a volatile market environment fueled by multiple economic and geopolitical factors, we wanted to offer some historical perspective we believe may help you feel a bit less anxiety over the state of your investment portfolio. All information below has been provided by JP Morgan in a series of charts and supporting text.
- Investing for the long-term, #1: We believe average annual returns are good tools to evaluate the success of your investment program. One of the most compelling contributors to positive average annual return is being invested on the days when the market has significant positive performance. Assume roughly 250 trading days per year - over 20 years, which is about 5,000 trading days. Performance metrics provided by JP Morgan show the best performance is achieved if you stay in the market for all 5,000 days. If you happen to miss the 10 best days (about 0.2% of all trading days), your average annual return for that 20 year period would be down 50%. If you miss the 20 best days – down about 90%. If you miss the best 30 days – your return would be negative. An interesting side note is that many of the best days occur shortly after the worst days.
- Investing for the long-term, #2 - It is also known that market performance over shorter periods of time can be more volatile than performance over longer time intervals. This can be seen when looking at performance of “rolling time periods.” Since 1950, the range of returns for stocks was:
- any 12 month (1 year) rolling period was +47% to -39%
- any 5 year rolling period, the range was +28% to -3%.
- any 10 year rolling period, the range was +19% to -1%
- any 20 year rolling period, the range was +17% to +6%
- Investing for the long-term, #3 – It is also known that diversification is a key element of portfolio construction because any single asset class does not outperform all other asset classes all the time. However, each asset class has a different range of returns. Some asset classes, like the S&P 500 are often considered to be representative of “the market”, but it also may be only 30% to 40% of your total portfolio. Over the 15 year period from 2007 through 2021, the S&P 500 has an average annual return of 10.6%. This includes being invested ALL trading days. In fact, most stock and bond asset classes were positive for this same 15 year period. The worst two investments during this period of time were cash (+0.80%) and commodities (-2.6%).
- Impact of geopolitical events #1 – We do not wish to minimize the humanitarian toll being borne by this current crisis or Russia’s position as a top exporter of oil and natural gas. At the same time, from a global economic perspective (i.e. World GDP), Ukraine represents 0.2%, Russia represents 1.8%, and the US represents 24.7% (data from the World Bank website).
- Impact of geopolitical events #2 - Another chart provided by JP Morgan shows how the S&P 500 suffered sell-offs that were largely caused by 12 specific geopolitical events since Arab/Israeli war of 1973. On average, each sell-off lasted 12 days with average drop of 6.5%. The average recovery back to the starting point was 137 days.
We cannot predict the future, but the past has shown us in many ways that staying invested for the long-term, no matter the cause or extent of world events, has consistently resulted in better positive average annual returns.

