

Investing during a Bear Market
Perspective from a Generation Z – And How it Can Relate to You
Investing for the long run is time-honored advice, but is it still relevant in today’s market?
Yes! A long run mentality is especially important given the current volatile market conditions and uncertainties surrounding the economy. Our team here at Rembert Pendleton Jackson ranges from age 23 (me) to our founder, Don, age 81. Our clients have an even broader age range. Do we all have the same investment expectations? Most likely not, but there are more complexities that need to be considered.
Age, risk tolerance, and lifestyle all impact investment strategies and cash flow. Up until recently, I lived at home and had minimal expenses. I saw April’s market dips and dives as buying opportunities. Some of the same shares I would have bought two weeks before were now significantly lower. I was getting great deals, much like the clearance racks at your favorite department store (that hopefully you will be able to visit again soon!). Even if the market continues to dip, I bought low, and invested the funds in a retirement account, which will not be liquidated for many years.
My Gen Z portfolio, which has minimal fixed income and cash, looks different from that of many boomers already in retirement, who are likely liquidating funds to satisfy their living expenses. I can afford to be aggressive, given my timeline, but for those looking for preservation of capital, I’m aware these market dips and dives can be stressful.
So, what can we all agree on, given different timelines, goals, and portfolio allocations?
Two historical trends are particularly noteworthy: according to Investopedia.com, since the inception of the S&P500 in 1926 through 2018, the average market return has been 10-to-11 percent[1]. Even during sharp and/or sustained declines (e.g., the Great Depression and 2008-09 crash) the market has averaged 10 percent. Second, since 1926, average rates of return following the bottoms of bear markets (i.e. declines from 10 to 20 percent, which we saw during March 2020, due to COVID-19), for 1, 3, and 5 years have all been positive, with an average return of 9.61 percent. This is depicted in the graph below:
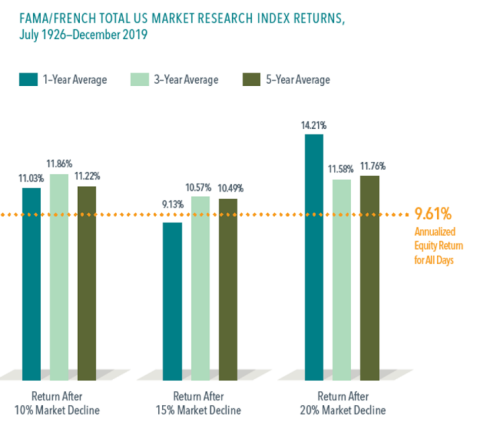
Thus, while past performance is no guarantee of future events, based on this historical data, we can expect an average return for 1-5 years following this year’s bear market to be similar to the historical return of the market. I anticipate my return from now until my retirement to be somewhere close to this number.
In effect, despite differences in age and investment time horizons, for the next 5 years most investors can expect similar average returns from the equities market. For this reason, I feel it is important to hang tight, see the light at the end of the tunnel, and trust historical statistics. Investing for the long run (i.e. staying the course) still seems prudent to me during these difficult times.